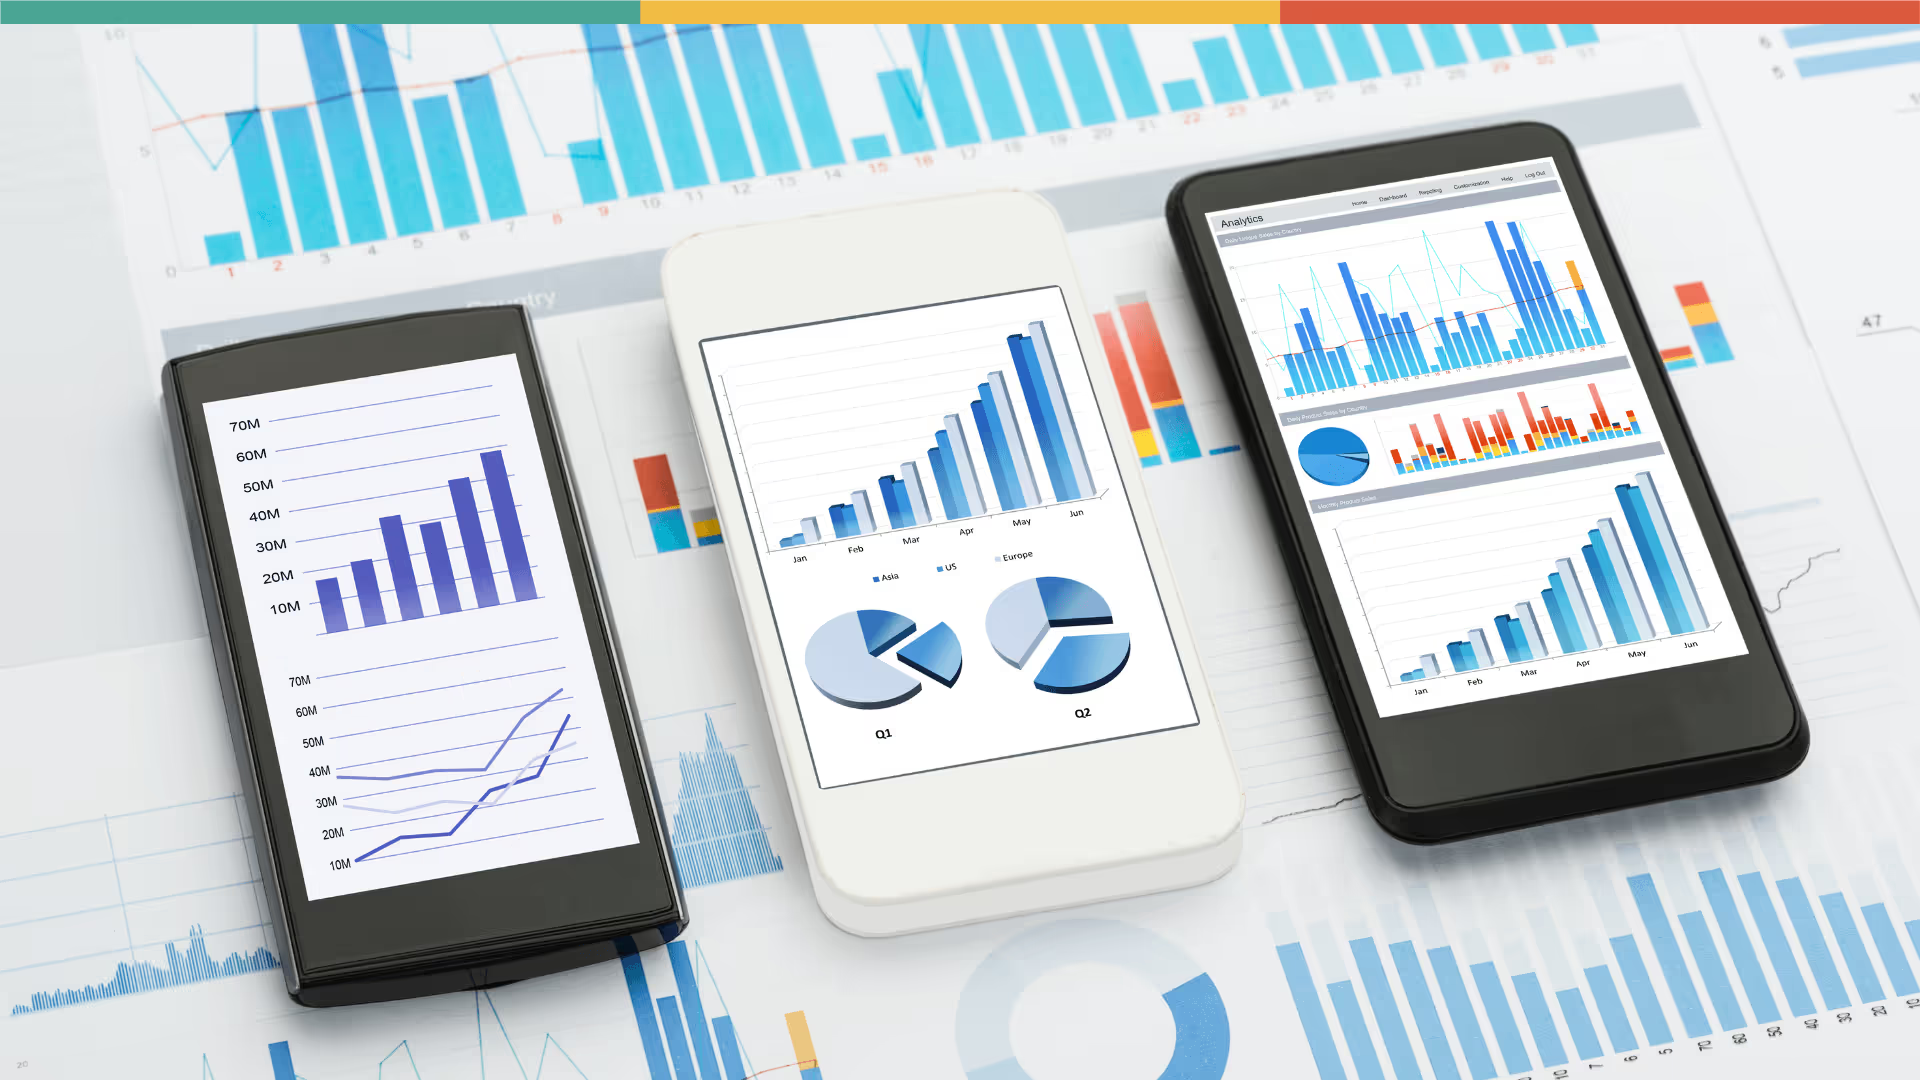
Entender quién utiliza tu aplicación y cómo interactúan con ella es lo que diferencia las aplicaciones exitosas de las abandonadas. Los análisis de aplicaciones móviles responden dos preguntas fundamentales que impulsan cada decisión de producto que tomarás.
¿Quién está utilizando la aplicación? Cuántas personas la han instalado, cuántas se han registrado, de dónde son, qué dispositivos están utilizando—los datos demográficos y de adquisición que moldean tu marketing.
¿Cómo la están utilizando? Qué secciones visitan más, qué les gusta, qué parece no gustarles, cuánto tiempo interactúan, cuánto tiempo pasan—los datos conductuales que moldean tu producto.
Ya sea que estés construyendo con el generador de aplicaciones impulsado por IA de Adalo u otra plataforma, rastrear las métricas correctas desde el primer día te proporciona la base para un crecimiento impulsado por datos. Aquí hay doce KPI que todo creador de aplicaciones debe monitorear.
Indicadores Clave de Desempeño a Rastrear
Los indicadores clave de desempeño (KPI) para análisis de aplicaciones móviles son métricas estándar de la industria que te ayudan a rastrear e informar sobre el desempeño, adopción y uso de tu aplicación. Rastrear KPI también es esencial para atraer la atención de inversores—quieren ver números concretos, no afirmaciones vagas sobre "crecimiento de engagement".
Rastrear los KPI de aplicaciones móviles debe estar integrado en tus planes de desarrollo y marketing desde el inicio. Define qué métricas de éxito y métricas de desempeño son más importantes para tu tipo de aplicación específica antes de lanzar.
#1 Descargas
El número de veces que tu aplicación se descarga a un dispositivo es la forma más fácil y obvia de rastrear la adopción. Esta es tu métrica de inicio de embudo—el interés inicial en tu aplicación antes de cualquier compromiso.
#2 Instalaciones
Las instalaciones reales de la aplicación pueden diferir de los números de descargas, por lo que esto proporciona una imagen más precisa de la popularidad de tu aplicación. Alguien podría descargar pero nunca completar el proceso de instalación.
#3 Desinstalaciones
Aunque no sepas exactamente por qué alguien desinstalación tu aplicación, puedes corroborar el momento con eventos como actualizaciones o cambios de características. Un pico en desinstalaciones después de un lanzamiento específico te dice que algo salió mal.
#4 Registros
Decidir si registrarse e ingresar datos personales indica si los usuarios están comprometidos con tu idea de aplicación. El beneficio de capturar direcciones de correo electrónico u otra información de contacto es que puedes mantener la comunicación con ellos—crítico para campañas de re-engagement.
#5 Suscripciones
Si tu aplicación ofrece opciones de suscripción para nuevo contenido o actualizaciones, rastrea tanto el número de registros como el tiempo hasta la suscripción después de la instalación. La duración promedio de la suscripción te proporciona información sobre el valor del usuario a largo plazo y ayuda a predecir ingresos.
#6 Tasa de Retención
Esto mide usuarios que regresan después de un período de tiempo fijo. Retener usuarios indica que has creado una aplicación "pegajosa"—una a la que la gente vuelve consistentemente.
La retención predice la monetización futura porque aumenta las perspectivas de compras dentro de la aplicación e impulsa mayores ingresos por publicidad. Define períodos de tiempo que funcionen para tu modelo de negocio. La mayoría de las empresas analizan retención de 7 días, 30 días, 60 días y 90 días.
La fórmula es sencilla:
Tasa de Retención = (# Usuarios en el día z / # Usuarios en el día a) x 100
Donde 'z' y 'a' son tus períodos de tiempo elegidos.
#7 Usuarios Activos
Los usuarios activos difieren de los recuentos de descargas porque miden el engagement real. Que alguien instale tu aplicación no significa que la usará—el smartphone promedio tiene docenas de aplicaciones sin usar.
Para mejorar los números de usuarios activos, atrae a las personas a abrir la aplicación más frecuentemente a través de promociones, notificaciones y recompensas. Adalo es un generador de aplicaciones sin código para aplicaciones web impulsadas por bases de datos y aplicaciones iOS y Android nativas—una versión en las tres plataformas, publicadas en la Apple App Store y Google Play. Sus aplicaciones nativas admiten notificaciones push de forma integrada, facilitando la implementación de campañas de re-engagement.
#8 Sesiones
El número de veces que un usuario abre tu aplicación cuenta como sesiones. Al igual que la retención, esto indica popularidad y pegajosidad. Define qué período de tiempo constituye una sola sesión para tu análisis—típicamente, una nueva sesión comienza después de 30 minutos de inactividad.
#9 Usuarios Activos Diarios (DAU)
El número de usuarios únicos que interactúan con tu aplicación cada día. Este es tu indicador del pulso de la salud del engagement diario.
#10 Usuarios Activos Mensuales (MAU)
El número de usuarios únicos que interactúan con tu aplicación mensualmente. La infraestructura modular de Adalo se escala para soportar aplicaciones con más de 1 millón de MAU, sin límite superior—importante saber a medida que tu aplicación crece.#11 Pegajosidad
La pegajosidad determina el engagement midiendo con qué frecuencia la gente regresa. Calcula dividiendo usuarios activos diarios (DAU) entre usuarios activos mensuales (MAU) para obtener un porcentaje.
Cuanto mayor sea el porcentaje, más frecuentemente regresan los usuarios. Pero recuerda: no todas las aplicaciones están diseñadas para uso diario. Una aplicación de preparación de impuestos tiene diferentes expectativas de pegajosidad que una aplicación de redes sociales. Define qué significa "usuario activo" para tu caso de uso específico.
#12 Tasa de Churn
La tasa a la que los usuarios activos se desuscriben o desinstalan tu aplicación. Quieres que este número sea bajo.
The rate at which active users unsubscribe or uninstall your app. You want this number low. Una tasa de abandono alta normalmente indica problemas de funcionalidad, problemas de rendimiento o contenido obsoleto.
La tasa de retención muestra cuántas personas se quedan; la tasa de abandono mide cuántas se van. El cálculo es simple:
1 – tasa de retención = tasa de abandono
Poner los KPI en Práctica
Estas doce métricas forman la base para optimizar tu aplicación y planificar estrategias de monetización. Pero rastrearlas requiere la infraestructura correcta desde el principio.
Al construir con Adalo, puedes integrar herramientas de análisis directamente en tu aplicación y almacenar datos de comportamiento del usuario en tu base de datos. Sin límites de registros en planes pagos y sin cargos basados en uso, puedes rastrear eventos de usuario granulares sin preocuparte por alcanzar límites de datos o facturas inesperadas a medida que crece tu base de usuarios.
La función X-Ray de la plataforma también identifica problemas de rendimiento antes de que afecten a los usuarios, ayudándote a detectar problemas que de otro modo podrían aparecer como picos misteriosos en tu tasa de abandono.
Más Allá de las Métricas Básicas
Estos doce KPI te dan una base sólida, pero son solo el comienzo. Si estás ejecutando campañas de marketing pagadas, querrás rastrear el costo por adquisición (CPA), el retorno de la inversión en anuncios (ROAS) y datos de atribución. Para aplicaciones con compras dentro de la aplicación, el promedio de ingresos por usuario (ARPU) y el valor de por vida (LTV) se vuelven críticos.
La clave es comenzar con estos fundamentos y expandir tu análisis a medida que tu aplicación madura. Rastrea lo que importa para tu etapa actual y agrega complejidad a medida que escales.
Preguntas frecuentes
¿Por qué elegir Adalo sobre otras soluciones de construcción de aplicaciones?
Adalo es un constructor de aplicaciones impulsado por inteligencia artificial que crea verdaderas aplicaciones nativas de iOS y Android a partir de una única base de código. A diferencia de los envolturas web, se compila en código nativo y se publica directamente en la App Store de Apple y Google Play Store—manejando automáticamente la parte más difícil de lanzar una aplicación.
¿Cuál es la forma más rápida de construir y publicar una aplicación en la App Store?
Ada, el constructor de IA de Adalo, te permite describir lo que deseas y genera tu app. Magic Start crea fundaciones de aplicaciones completas a partir de una descripción, mientras que Magic Add agrega funciones mediante lenguaje natural.
La interfaz de arrastrar y soltar de Adalo te permite construir visualmente, mientras que características asistidas por IA como Magic Start generan bases de aplicaciones completas a partir de descripciones. La plataforma maneja el proceso de envío de la App Store, eliminando las barreras técnicas que típicamente ralentizan los lanzamientos.
¿Puedo rastrear fácilmente análisis y KPI de aplicaciones para mi aplicación móvil?
Sí, las aplicaciones de Adalo se integran con herramientas de análisis para rastrear indicadores clave de rendimiento. Puedes monitorear descargas, usuarios activos, tasas de retención y métricas de engagement para entender el rendimiento y hacer mejoras basadas en datos.
¿Cuál es la diferencia entre descargas e instalaciones como métricas de aplicaciones?
Las descargas se refieren al número de veces que una aplicación se descarga en un dispositivo, mientras que las instalaciones rastrean cuándo la aplicación se instala y se configura realmente. Estos números pueden diferir, por lo que es importante rastrear ambos para obtener una imagen precisa de la adopción.
¿Cómo calculo la tasa de retención de mi aplicación?
La tasa de retención se calcula usando la fórmula: (# Usuarios en el día z / # Usuarios en el día a) x 100, donde 'z' y 'a' son tus períodos de tiempo elegidos. Los marcos de tiempo comunes incluyen retención de 7 días, 30 días, 60 días y 90 días.
¿Qué significa 'pegajosidad' en análisis de aplicaciones?
La pegajosidad mide con qué frecuencia los usuarios regresan a tu aplicación, calculada dividiendo los usuarios activos diarios (DAU) por los usuarios activos mensuales (MAU). Un porcentaje más alto indica retornos más frecuentes, aunque la pegajosidad esperada varía según el tipo de aplicación.
¿Cómo puedo mejorar el número de usuarios activos de mi aplicación?
Atrae a los usuarios para que abran la aplicación más frecuentemente a través de promociones, notificaciones push y recompensas. Rastrear sesiones, DAU y MAU te ayuda a entender el engagement actual y medir la efectividad de las estrategias de retención.
¿Rastrear análisis detallados aumentará los costos de mi aplicación?
Con los planes pagos de Adalo, obtienes registros de base de datos ilimitados y sin cargos basados en uso, por lo que puedes rastrear eventos de usuario granulares sin preocuparte por límites de datos o facturas inesperadas a medida que crece tu base de usuarios.
Construye tu aplicación rápidamente con una de nuestras plantillas de aplicación prediseñadas
Comienza a construir sin códigoContenido Relacionado

Lanzar una aplicación móvil: Cómo crear un plan de marketing
Tu aplicación móvil no se va a vender sola, sin importar lo bien diseñada que esté. ¡Por eso el marketing de aplicaciones móviles es clave para su éxito!
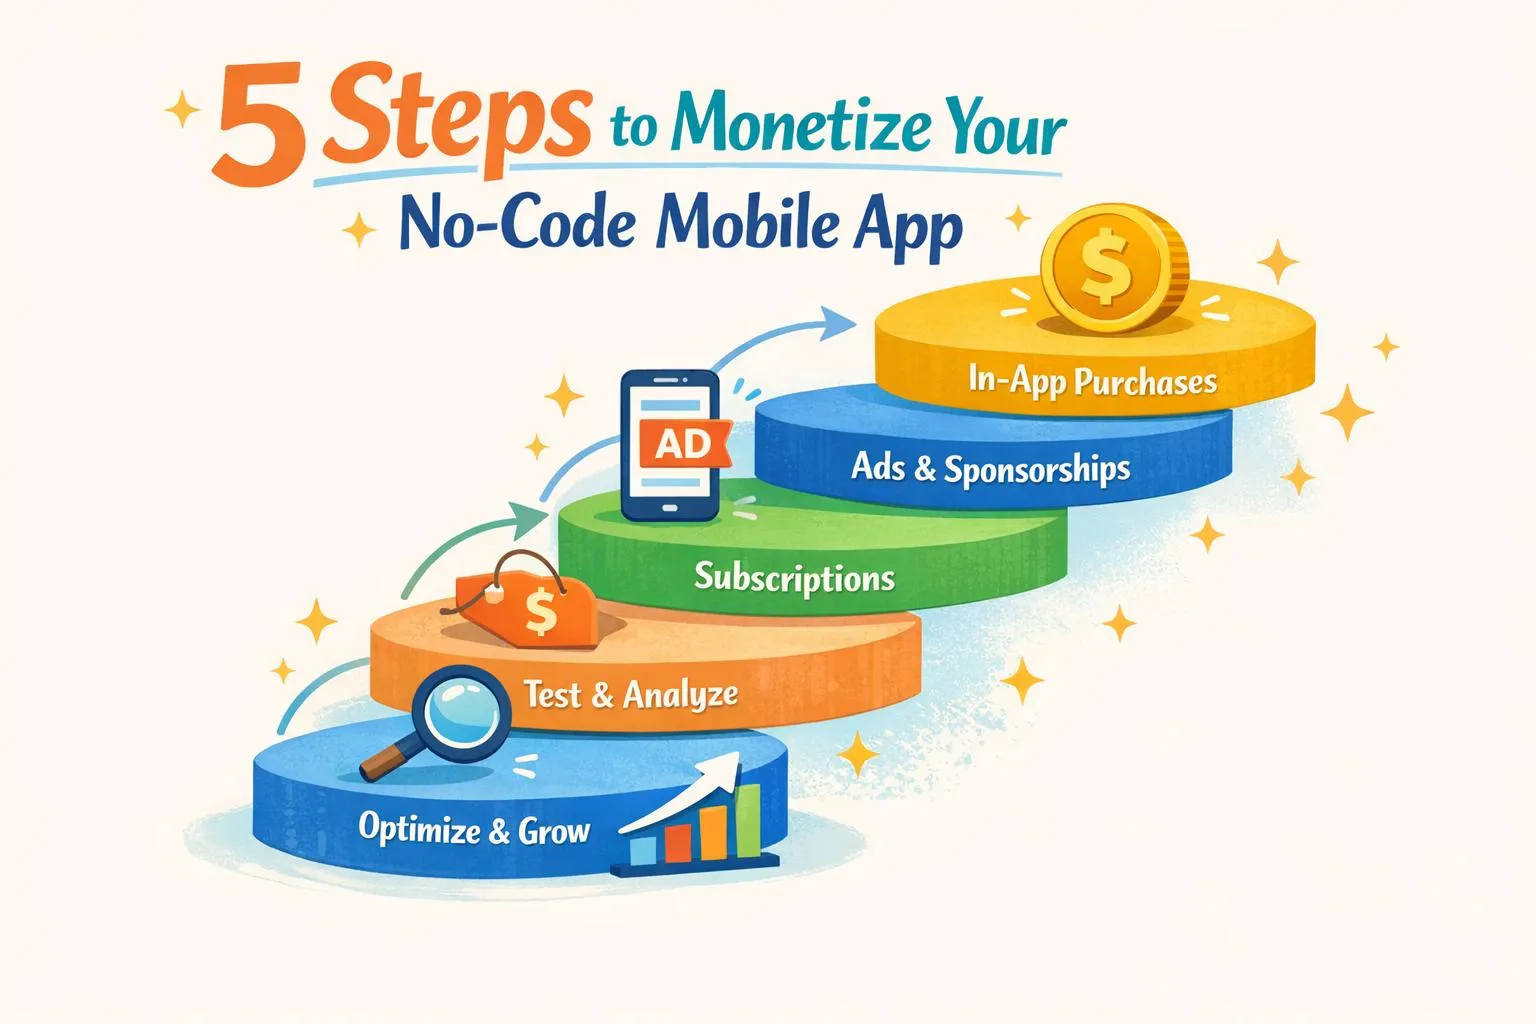
5 pasos para monetizar tu aplicación móvil sin código
Cinco pasos prácticos para monetizar tu aplicación móvil sin código: elige un modelo, integra pagos o anuncios, fija precios estratégicamente, prueba y optimiza
Guía 2026 de Adalo para Constructores de Aplicaciones Móviles Sin Código Impulsados por IA
Guía 2026 de Adalo para Constructores de Aplicaciones Móviles Sin Código Impulsados por IA
Adalo ofrece herramientas sin código impulsadas por IA para ayudar a fundadores y startups a crear y publicar aplicaciones responsivas utilizando APIs e integraciones personalizadas.
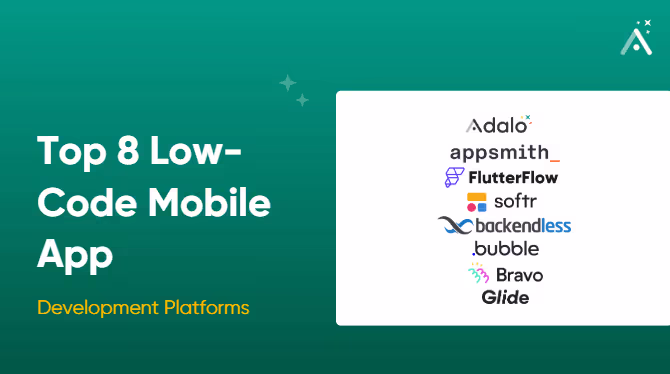
Las 8 Mejores Plataformas de Desarrollo de Aplicaciones Móviles Low-Code para 2026 🚀
Explora las 8 mejores plataformas de desarrollo de aplicaciones móviles con bajo código para 2025, incluyendo características clave, precios y usuarios ideales.